A patient
admitted with atrial fibrillation (AF) was later noted to have this. Do you see
conversion to sinus rhythm?

Image 1 – ECG case

Image 2 - ECG case marked with arrows to highlight PR
interval variation
This is a
regular narrow QRS complex rhythm with a ventricular rate of about 80’s.
Variation in the PR interval can be observed as marked with arrows. So, is this
sinus rhythm with variable PR interval? This pattern cannot be explained by
dual AV node conduction or concealed conduction. In dual AV node conduction,
there are 2 pathways in the AV node which are designated as slow pathway (SP)
and fast pathway (FP). In dual AV node conduction with dual AV node physiology,
we should see 2 PRI’s (one short and one long) and the PRI change is usually
sudden (Image 3).

Image 3- Sinus rhythm with dual AV node physiology.
After QRS #5, there is sudden prolongation of PRI (~520 ms).
So can this
be atrial flutter or atrial tachycardia (AT)?
Atrial
flutter (AFL) and atrial fibrillation (AF) can occur in the same person. They
can appear on the same electrocardiogram as atrial flutter-fibrillation or
“impure atrial flutter”. According to Braunwald’s Heart Disease – A Textbook of
Cardiovascular Medicine ( 10th ed) -
“Atrial fibrillation (AF) is a supraventricular
arrhythmia characterized electrocardiographically by low-amplitude baseline
oscillations (fibrillatory or f waves) and an irregularly irregular ventricular
rhythm. The f waves have a rate of 300 to 600 beats/min and are variable in
amplitude, shape, and timing. In contrast, flutter waves have a rate of 250 to
350 beats/min and are constant in timing and morphology. In lead V1, f waves
sometimes appear uniform and can mimic flutter waves (Image 4). The distinguishing
feature from atrial flutter is the absence of uniform and regular atrial
activity in other leads of the electrocardiogram.”

Image 4 – An example of atrial fibrillation with
prominent f waves in V1 that mimicked atrial flutter. The typical f waves can
be seen in lead II.
Treatment
of atrial flutter with digitalis (digoxin) shortens the atrial refractory
period and often converts atrial flutter to atrial fibrillation. Conversely
treatment with sodium channel-blocking drugs (quinidine or procainamide) often
converts atrial fibrillation to atrial flutter as transitional stage before
restoration to sinus rhythm. During transition the flutter cycle tends to be
irregular and the flutter morphology is variable.
Patients
with markedly enlarged atria (and massive dilatation) tend to have slower rate
or atrial flutter that could have rates of less than 200 beats per minute.
Patients on antiarrhythmics can also decrease the atrial flutter rates. The
resulting decrease in the atrial flutter rate will reveal the isoelectric
interval we typically see in focal atrial tachycardia.
Atrial
tachycardia (AT) is defined as a regular atrial rhythm originating from the
atrium at 100 bpm to 240 bpm. As mentioned above, atrial flutter can look like atrial
tachycardia if patients are on antiarrhythmics or with atrial myopathy. Atrial
tachycardia in a scarred atrium can be rapid and mimic atrial flutter. So, it
is a matter of semantics to define AT or AFL based on surface ECG features.
How to prove that this is not sinus rhythm but either
atrial flutter vs atrial tachycardia?
1.
Heart Rate
Histogram or Heart Rate Trend

Image 5 – Heart Rate Histogram of the case
The Heart
rate histogram is the graphical representation of the heart rate over time. It
has a number of uses in cardiac telemetry. It can guide us that a rhythm could be
atrial tachycardia or atrial flutter rather than sinus rhythm. Atrial
tachycardia or atrial flutter will have a flat histogram (Image 5 and 6).

Image 6 – A “flat” histogram (from a GE system) from a
patient with atrial flutter. The heart rate was 120’s for several hours. A
histogram of sinus rhythm will show variations in heart rate.
2.
The Role of
a premature ventricular complex (PVC) in arrhythmia diagnosis
A PVC can
unmask a “hiding P wave”. In the case, the “hidden” P (arrows) wave was
revealed by a properly time PVC. The atrial rate was about 187 bpm (Image 7).
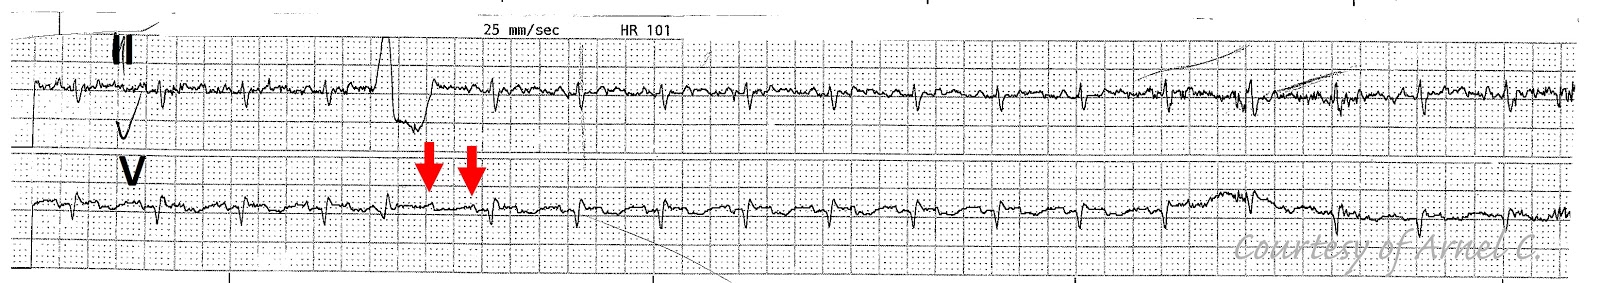
Image 7 –
After a wide QRS beat, 2 distinct P waves can be seen at a rate of about 187
bpm.
3.
The drop in
rate
If you
follow the heart rate histogram where the heart rate decreased, you can see the
strip below. This further supports that case is not sinus rhythm but can either
be atrial tachycardia vs. atrial flutter (Image
8). The atrial rate is about 187 bpm.

Image 8 – The
arrow shows distinct P waves in leads II and V with a rate of about 187 bpm.
Back to the
case
So, in the case presented is not sinus rhythm (no conversion)
but could either be atrial flutter
(slow) vs. atrial tachycardia with 2:1 AV conduction.
#678
No comments:
Post a Comment
Note: Only a member of this blog may post a comment.