The
P wave or organized atrial activity is one of the keys to decipher the rhythm.
If you have been watching these waves for so long then it becomes easy. When I
say so long, it does not mean reading multiple 10 seconds strips but watching
hours of continuous multiple lead ECG's. I do not know how to explain to you
how to improve that skill but I can show some strips collected to search for
those P waves. One tip I think that can verify whether those bumps are not artifacts is to check simultaneous leads. If they are consistent then those are real atrial activities.
In
this exercise, I will show to you multiple leads and not only 2 leads. For
people who are satisfied in interpreting rhythms using 2 leads then you are
missing a lot of things.
Case
# 1 - Can you see the P waves?

Figure # 1 -

Figure # 2 - P waves are marked
with red arrows. P waves are seen distorting the latter part of the T waves.
This is sinus tachycardia with P waves partially hidden from view.
Case
# 2 - This is from a patient with COPD exacerbation. Can you see the P?

Figure # 3

Figure 4 - P waves are marked with
red arrows. Compared to case # 1, P waves are more challenging. This is sinus
tachycardia.
Case
# 3 - Can you see the P?
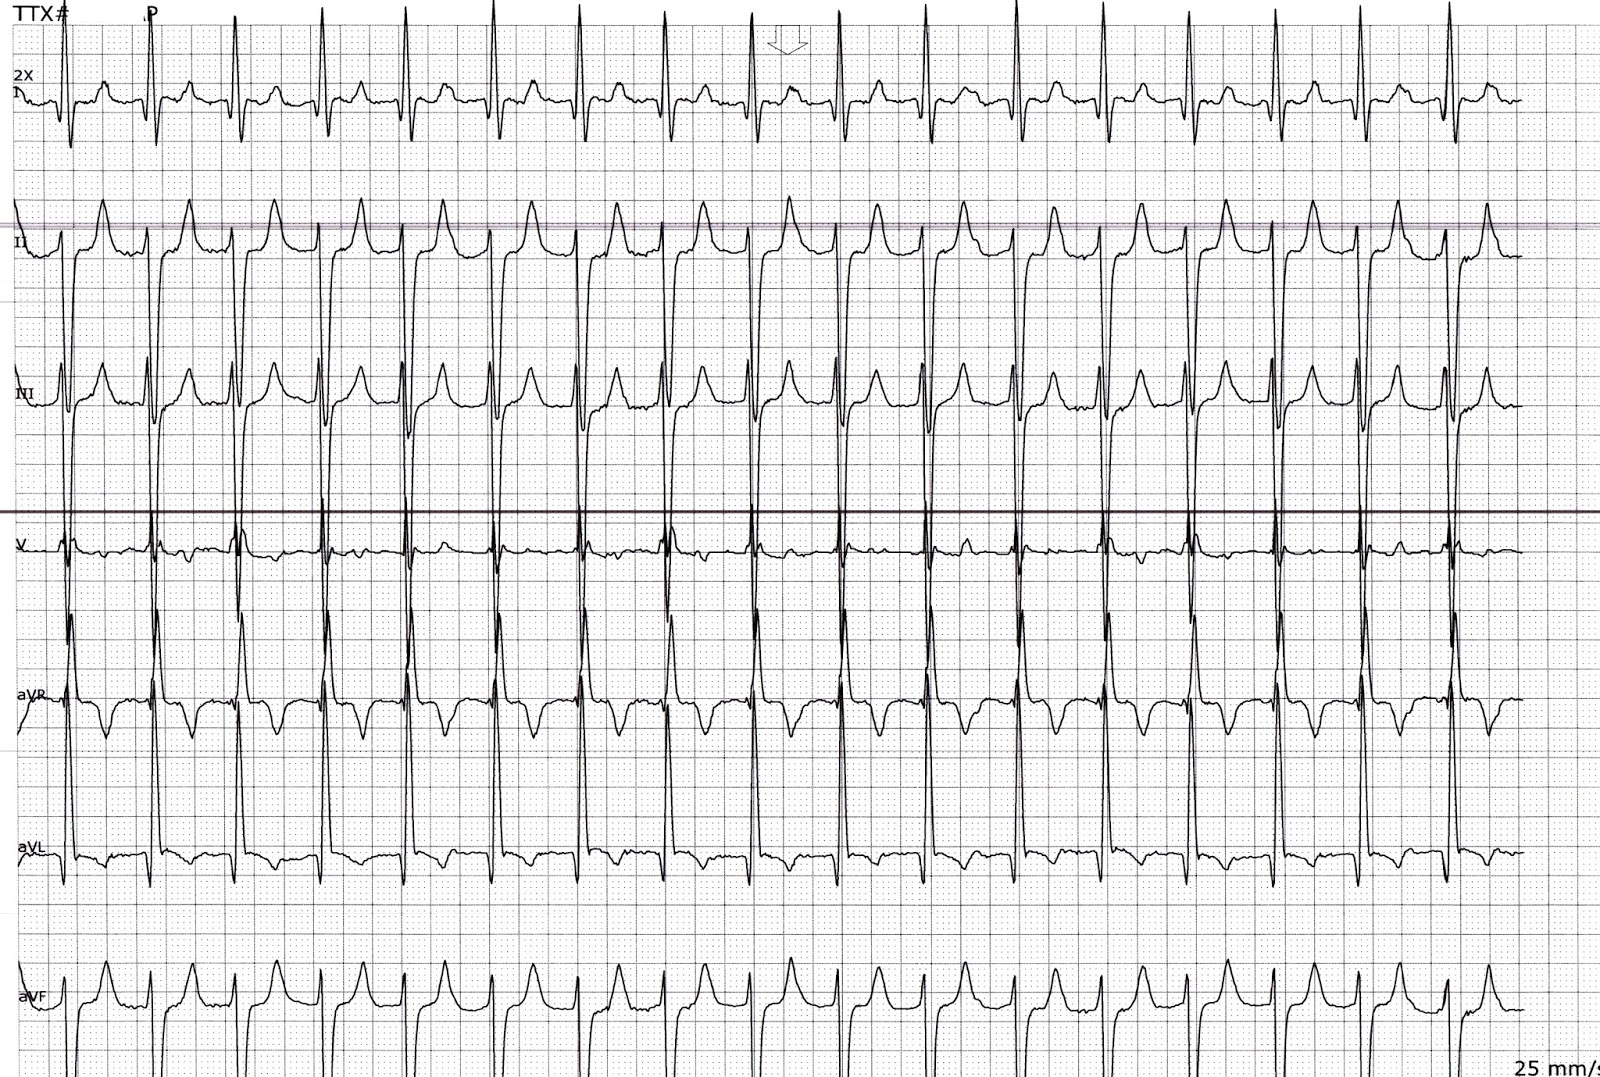
Figure # 5

Figure # 6 - P waves are marked
with red arrows.
Case
# 3 turned out to be atrial tachycardia. If you catch regular tachycardias in
the middle of the cycle, it is difficult to tell if it is sinus tachycardia vs.
atrial tachycardia. You have to catch the beginning and termination of the
arrhythmia or observe the heart rate histogram. Sinus tachycardia histogram
will show gradual increase and decrease and heart rate but not atrial
tachycardia.

Figure # 7 - Termination and
initiation cycle for case # 3
Case
# 4 - This is a patient c/o palpitations. Can you see the PAC with a long PRI?

Figure # 8

Figure 9 - The initiation of the tachycardia is
shown showing a PAC (red arrow) with long PR interval. After that inverted P
waves can be seen representing retrograde P waves of a supraventricular
tachycardia particularly AV nodal reentry tachycardia.
The
only way to hone your skills in ECG interpretation is look at a lot of strips
and not just reading books. I can say this because most books will only show
the classic ones but in the real world, there are a lot of non-classic ECG's
and will not follow textbook examples.
#648
Thanks! Very useful!
ReplyDelete